Enhancing the reliability of Out of Distribution Detection
This post will deal with advanced version and a comparison with this post
Tom: Hey let us talk about a new paper called ODIN that improves our baseline for Out of distribution detection paper.
Jerry: How does this paper improve the baseline method?
Tom: In this paper they consider the Softmax score as the confidence score as like in baseline but make small changes to the input by perturbing it. They also use temperature scaling to increase the gap between In distribution and Out of Distribution.
Jerry: That sounds simple and elegant but can you tell me what is temperature scaling?
Tom: Temperature scaling is when a single scalar hyperparameter T is used to increase the entropy of the given logit. By choosing this hyperparameter very carefully we can push the softmax scores of In and OOD samples further apart thereby making it very distinguishable. Mathematically we can represent the softmax score with Temperature scaling as
\[S_i(x;T) = \frac{\exp(f_i(x)/T)}{\sum\limits_{j=1}^N \exp(f_j(x)/T)}\]Jerry: Can you tell more about the Input Preprocessing that you were talking about?
Tom: The input preprocessing is simple. inspired by goodfellow in this paper the input is perturbed a little. This is given by \(\tilde{x} = x - \varepsilon sign(-\nabla_x log S_{\hat{y}}(x;T))\). The aim of this input pre-processing is to increase the softmax for any input without any class label.
Jerry: That seems a bit counter intuitive if the softmax score is increasing for all inputs.
Tom: The experiments that they do confirm that the input pre-processing increases the softmax for in-distribution samples more than the OOD samples thereby making them more separable.
The entire algorithm works as follows
- For each image calculate pre-processed image \(\tilde{x}\)
- Feed this into the classification network and calculate the Softmax score
- Compare softmax score to threshold if above threshold then sample is In-Distribution else it is Out of Distribution.
Jerry: How is this threshold taken?
Tom: The threshold and other hyperparameters are chosen such that the true Positive rate(TPR) of the OOD dataset is 95%.
Jerry: What metrics do they evaluate the model on?
Tom: The main metrics used are as follows
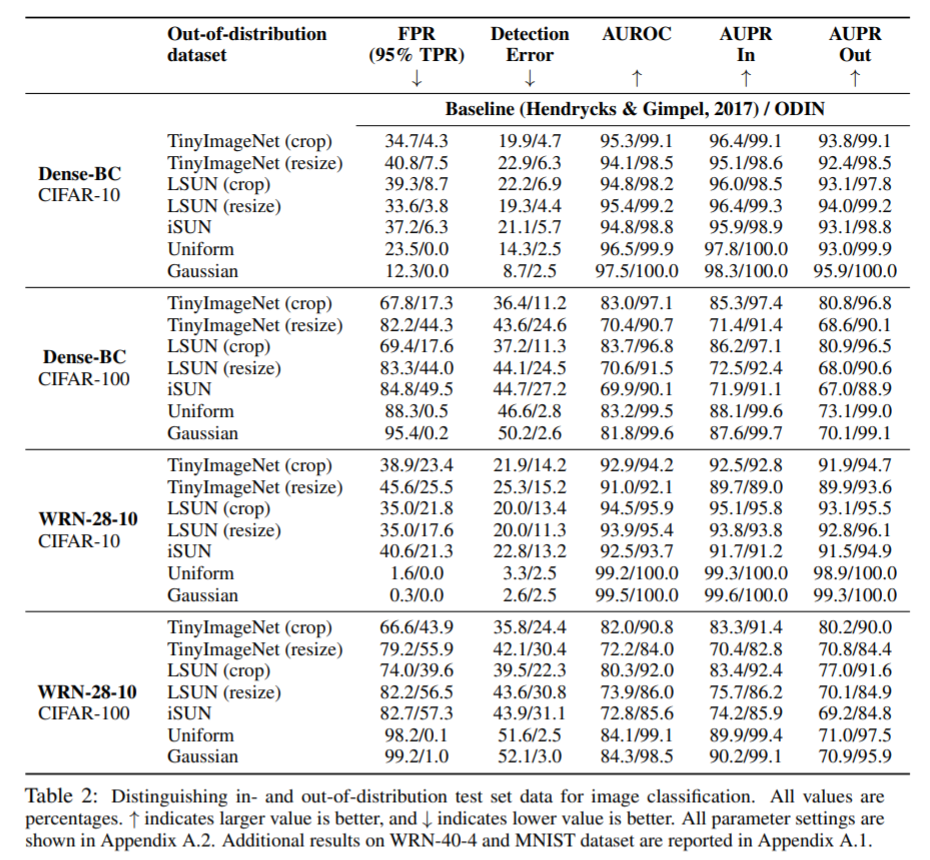
False Positive rate at 95% True Positive rate : This represents the probability that example is misclassified as positive when true positive rate is 95%.
Detection error Measures the misclassification probability when TPR is 95%.
AUROC The probability that a positive sample is assigned a higher detection score tthan a negative sample. The random detector shows 50% and perfect detector shows 100%
AUPR Area under precision recall curve, probability that a sample is positive in precision recall curve.
Jerry: What are datasets used?
Tom CIFAR-10 and CIFAR-100 are used as In-Distribution datasets. For OOD samples the following datasets are used TinyImageNet, LSUN, iSUN, Gaussian Noise, Uniform Noise.
Jerry: What are the key takeways from the results?
Tom: The key takeways can summarized as below