Baseline for Out of Distribution Detection
Tom and Jerry are two data scientists meeting on a meetup. They generally discuss papers. Tom is a dedicated reader who pre-reads before coming to meetup and Jerry generally learns by breaking Tom’s lecture with questions.
Scene
Jerry: Hi, Tom what are you upto nowadays. Are you a data janitor or you get to do some modelling as well?
Tom: Hi Jerry, I finally have some modelling work apart from being the data Janitor and for that I have been reading a paper which I think is quite interesting for all people working with Neural network models.
Jerry: Ah what is the name of the paper and why is it so interesting?
Introduction:
Tom: The paper is called A baseline for detecting misclassified and Out of distribution examples in Neural networks.We know that A Neural network(NN) trains on a given set of data and predicts output according to task as classification or segmentation or Sentiment analysis. One common problem is that during deployment(test time) it is unrealistic to expect the same distribution from the test data as well. For a given classification task the state of the art method fails when the test image is out of classes on which the classifier is trained. This paper tells a way to detect the failure.
Jerry :How is the model failing?
Tom: The failure is in the form of high confidence prediction. High confident prediction means that the margin of error is generally high. Now this scenario is very bad for certain kind of problems that require precise answers like in the field of medical domain and autonomous driving, erroneous answers in the field have very huge impact on life.
Jerry :How are these high confidence predictions produced by the model?
Tom :These high confidence predictions are produced by the softmax function. The Softmax is computed with the exponential probabilities. The softmax function is given by \(\frac{e^{x_i}}{\sum_{i=1}^{N} e^{x_i}}\). Small changes in logits would mean that there are bigger changes in the output.
Jerry : Oh that sounds bad. How to solve this issue?
Tom : This issue is called detecting out of distribution. The Out of distribution samples tend to have lower softmax values compared to in-distribution (training) samples when passed through a NN. So analyzing the statistics prediction probabilities or softmax values for incorrect or abnormal samples will give a good picture. But viewing just one sample prediction probability maybe misleading and is a wrong approach.
Jerry Then can it be assumed that the approach is state of the art?
Tom: That is where the paper gets interesting. The authors have themselves chosen few tasks and shown that beating the baseline results are possible. Another Interesting aspect is that they have worked on tasks from three major data science communities of Vision, Audio and Natural language. Let us talk a little about how they pose the problem and details
Jerry: Sure, I am curious already
Problem Statement
Tom: The authors examine 2 related problems of error and success prediction and in and out of distribution detection. I would like to focus on Out of distribution detection as the main problem and present the experiments and results accordingly.
Jerry: Can you explain in what exactly the authors are trying in Out of distribution detection?
Tom Sure, By Out of distribution detection they want to check if there are means of detecting whether a test sample belongs to same distribution as training data (In distribution) or from a different distribution (Out of distribution).
Jerry: Is there an evaluation metric or just softmaxes are used?
Tom: The authors say that comparing two detectors is not easy as just comparing their accuracies. This could be flawed as one detector may be measuring positive samples and other negative ones. So we should come up with a metric that should specify a score threshold where positive samples are classified correctly and then measure performance. As a result of such measure they empoy AUROC metric (Area under receiver Characteristic curve) and AUPR (Area under precision recall curve).
Jerry How do these metrics work?
Tom: Both the metrics mentioned are threshold independent. The ROC curve is a graph measuring true positive rate and false positive rate against each other. AUROC can be interpreted as probability that a positive sample has a greater detector score than negative class. The AUPR plot precision against recall and this ranges between a baseline of Precision value and 100% for perfect classifier. Since the aim is to detect Out of distribution samples they are considered as positive class.
Method
Tom : Let me explain the method now.We have a classifier currently trained on some data and during test time we retrieve predicted class probability from a softmax distribution and use it as a score. We then pass these values through the metrics and get to know the performance of classifier. In our Case we treat the correctly classified in in-distribution samples as positive and run metrics on them. For Out of distribution (OOD) we run metrics on classified OOD samples as Positive and use the negative of the score to run through metrics.
Jerry: That sounds interesting do you have some results to share?
Tom: 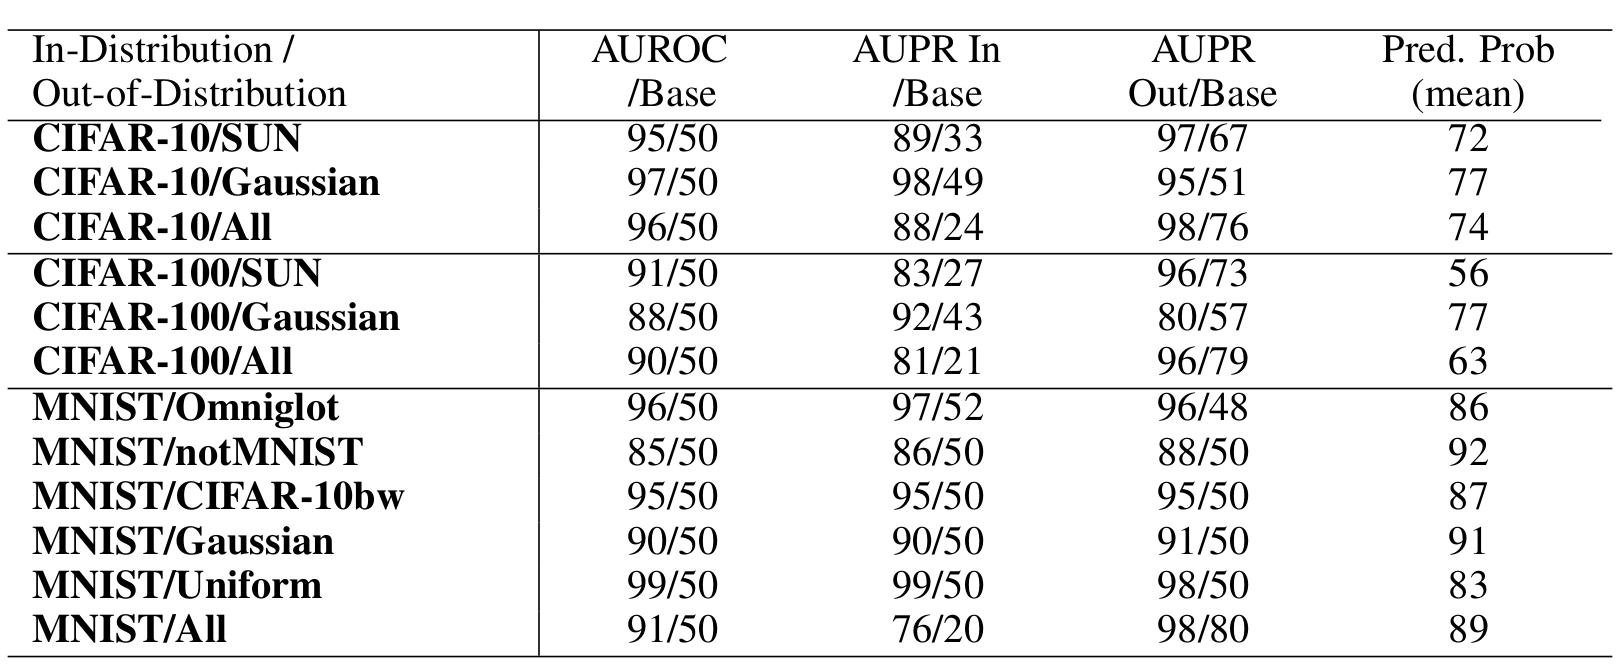 . For the vision the authors use the following datasets.
- MNIST (In) and Omniglot, notMNIST, CIFAR-10bw(black white)
- CIFAR (In) and SUN(Scene understanding) as OOD datasets.
Jerry So the results look good but I have two questions
- How do you select the OOD datasets?
- Is OOD dataset shown during training?
Tom:
- The OOD datasets are chosen in this paper are mostly in understanding that grayscale image detector can work only with grayscale images and color with color images. The OOD datasets must be different from the In-distribution dataset.
- No OOD dataset is not shown during training. It is only shown during test-time and the scores are calculated then.
Conclusion and code
Tom : So we have a baseline now for Out of distribution detection. This paper indeed shows that there is a simple way with pre-existing classifiers to check for OOD samples during test time. Once we detect that it is an OOD sample we can leave it out then measure other metrics to report performance.
Jerry: Is there a github repo for this paper somewhere to play with the code?
Tom: Yes there is, Github link.